Understanding Probability and Randomness using a coin
Posted on Sat 18 April 2020 in Python, Statistics
I was refreshing my understanding of probability and random chance. I think that a simple experiment of tossing a coin and observing the result is very useful in understanding these concepts.
As we know a coin when tossed/flipped will result either in a HEAD or TAIL. So a simple question to answer is "If I toss a fair coin (equal chance of Head and Tail) 1000 times, how many times do you expect to get HEADS?"
Is it 500 or in other words the fraction of heads is 0.5?
Actually the answer is complicated. It may be 500, but it could be also above 500 or below 500. There is going to be uncertainty/randomness in the number of heads or the fraction of heads.
To investigate more about the nature of this randomness, lets define some terms to make it easy to follow this write-up.
We can define
-
a trial as series of tosses. Each trial is characterized by certain number of tosses and associated fraction of heads that result from this trial.
-
an expt run is a series of one or more trials.
Understand these definitions before we can move ahead.
Questions to ask:
-
Will the fraction of heads in a trial change between expt runs?
We will see that for each trial in different expt run, we will get different fraction sometimes above 0.5, sometimes exactly 0.5 and sometimes below 0.5.
-
Does this behavior change if there are more tosses in a trial?
No. But, we will see that as the number of tosses in a trial increases (lets say the number of tosses change from 500 to 20000), the fraction of heads approaches towards 0.5 or in other words the uncertainty in the fraction of heads decreases.
To understand these insights, lets start make a python class that mimics the behavior of fair coin and play with it.
1 2 3 4 5 6 7 8 9 10 11 12 13 | |
Lets run an expt with one trial. In this trial, we will toss the coin 100 times. Lets check if our newly minted coin is tossing as we expect
1 2 3 4 5 6 7 8 9 10 11 12 13 14 15 16 17 18 19 20 21 22 23 24 25 | |
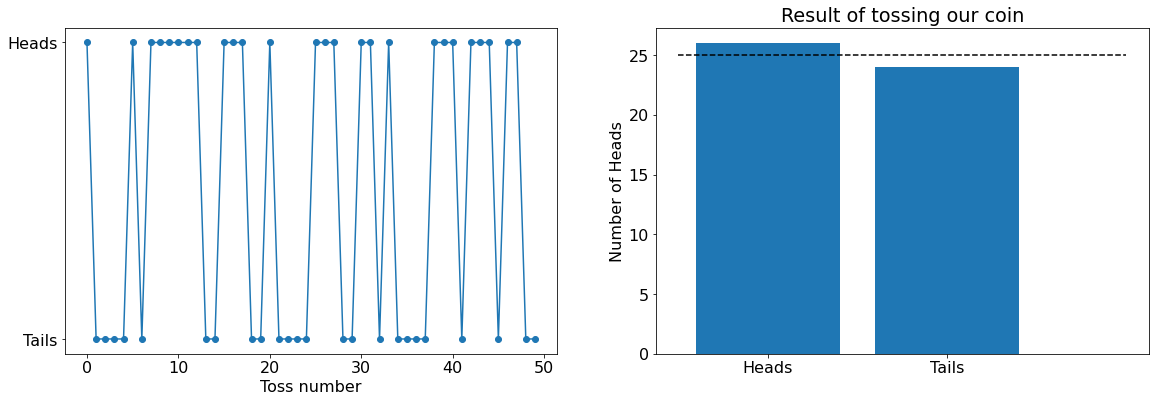
As expected it is generating 'Heads' and 'Tails' randomly with the number of tosses. But you can see that the number of 'Heads' is not exactly the half of the tosses. If we repeated this expt of one trial, we will get different numbers. So there will uncertainty in the fraction of heads.
To understand that uncertainty, lets conduct a series of expt runs. For each run, we will conduct different trials consisting of different number of tosses and calculate the fraction of heads in each trial.
The outline of our expt is as follows:
Expt Run1:
Trial 1 (Toss for 50 times). Calculate the fraction of heads.
Trial 2 (Toss for 100 times). Calculate the fraction of heads.
...
Trial x (Toss for 20000 times). Calculate the fraction of heads.
Expt Run2 Repeat of Run1
Expt Run3 Repeat of Run 1
...
Expt Run 10
Lets write some code to do this.
1 2 3 4 5 6 7 8 9 10 11 12 13 14 15 16 17 18 19 20 21 22 23 24 25 26 27 28 29 30 31 32 33 34 35 | |
This results in
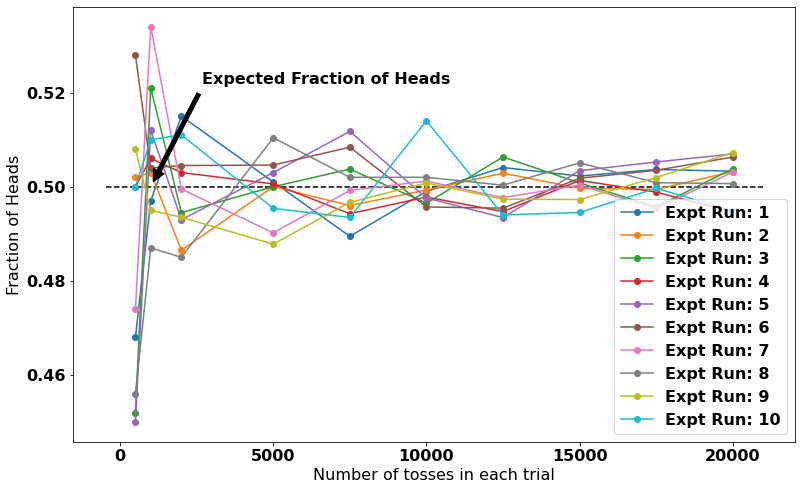
What do you see from this figure?
Each datapoint is a result of trial. Each colored series is a expt run.
1) Lets look at fraction of heads at a certain trial, it is sometimes above 0.5 and sometimes below 0.5 depending on the expt run.
2) The variation (spread of fraction of heads) is getting lesser with more number of tosses in a trial. It is approaching 0.5 but is never 0.5.
In other words, if we define the uncertainty as the standard deviation (parameter estimating the variation) among various expt runs (at the same number of tosses). We can say that the uncertainty is decreasing with the number of tosses.
Is there a precise relationship of this uncertainty? Yes there is.
Lets plot that and see if we can fit it with a mathematical function
1 2 3 4 5 6 7 8 9 10 11 12 13 14 15 16 17 18 19 20 21 22 23 24 25 26 27 28 | |
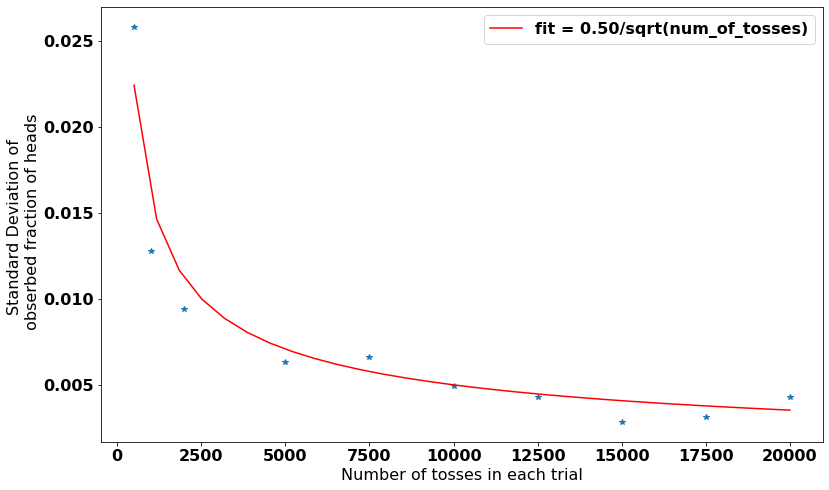
The code tried to fit the relationship between the uncertainty in fraction of heads and the number of tosses with a function of a form a/sqrt(n), where n is the number of tosses and a is constant. The fits looks pretty good, so we can conclude that it is following inverse of square root of n relationship. This is an important conclusion and can be also proved mathematically. It forms the basis of many statistical tests and parameters like standard errors and confidence intervals.
So what does it means to say a coin has a probability of 0.5? If we have very large number of tosses in a trial, then we could expect the fraction of heads to be very close to a value of 0.5.
Another interesting thing that we notice is... why did the curve fitting came up with a=0.5? Thats for another day.